Transaction-Level Excel Reporting System
Objective
Build an Excel-based reporting system that transforms ERP-style transactional sales data into reconciled, executive-ready KPIs.
The workbook preserves transaction-level detail, defines revenue and rate logic at the row level, validates totals before aggregation, and produces structured reporting views that reconcile back to source data.
Dataset Context
Dataset: Simulated retail transaction dataset
Period Covered: 2024-08-03 to 2025-01-30
Volume: 1,000 transaction line items
Structure: 32 fields
Grain: One row represents a single product-level transaction line item
The dataset simulates ERP-style retail transaction structure and grain.
The full field list is available in the workbook.
Source dataset: Retail Sales Dataset (Kaggle)
Cross-field reconciliation identified 399 line items (39.9%) where TransactionStatus, PaymentStatus, and ShippingStatus do not align. These inconsistencies were disclosed and carried forward without modification.
Workbook Build (Excel Structure)
All transformation, validation, and aggregation work occurs inside the Excel workbook before any reporting views are generated.
Data_Raw (Intake Layer)
- Raw CSV loaded directly as a table
- Source values preserved as recorded
- No transformations applied at intake
This sheet functions as the immutable reference point for the entire model.
Data_Working (Row-Level Driver Layer)
All KPI logic is defined at the transaction level in this sheet.
Each row represents one product-level transaction line item.
Constructed fields include:
- LineRevenue = FinalSalePrice x SalesQuantity
- NetRevenueLine = LineRevenue when TransactionStatus = Completed, else 0
- Month (YYYY-MM) derived from TransactionDate
- CancelFlag, CompletedFlag, ReturnFlagNum (binary 1/0 indicators)
Text and boolean status fields were converted to binary indicators (1/0) to support consistent pivot aggregation.
Business logic remains defined in Data_Working rather than inside pivot tables.
Checks (Pre-Aggregation Audit)
Before any pivot tables were created, the following validations were completed:
- Row count confirmed (1,000 rows)
- Gross LineRevenue reconciled
- Completed-line revenue independently cross-checked
- Status distribution totals reconciled
- ReturnFlag vs TransactionStatus discrepancies quantified
No summary views were built until these checks aligned.
Aggregation begins from a validated base.
Pivot Engine (Aggregation Layer)
All aggregation is performed using pivot tables built from Data_Working:
- PT_Monthly
- PT_Mix
- PT_Mix_Channel
- PT_Mix_Region
- PT_Operational
- PT_Status
Pivot tables aggregate validated row-level drivers only.
Rates are calculated outside the pivot using explicit denominators.
No pivot filters or calculated fields define KPI inclusion logic.
Pivot grand totals reconcile exactly to working-layer totals.
Reporting Views (Presentation Layer)
All reporting tabs reference pivot outputs directly.
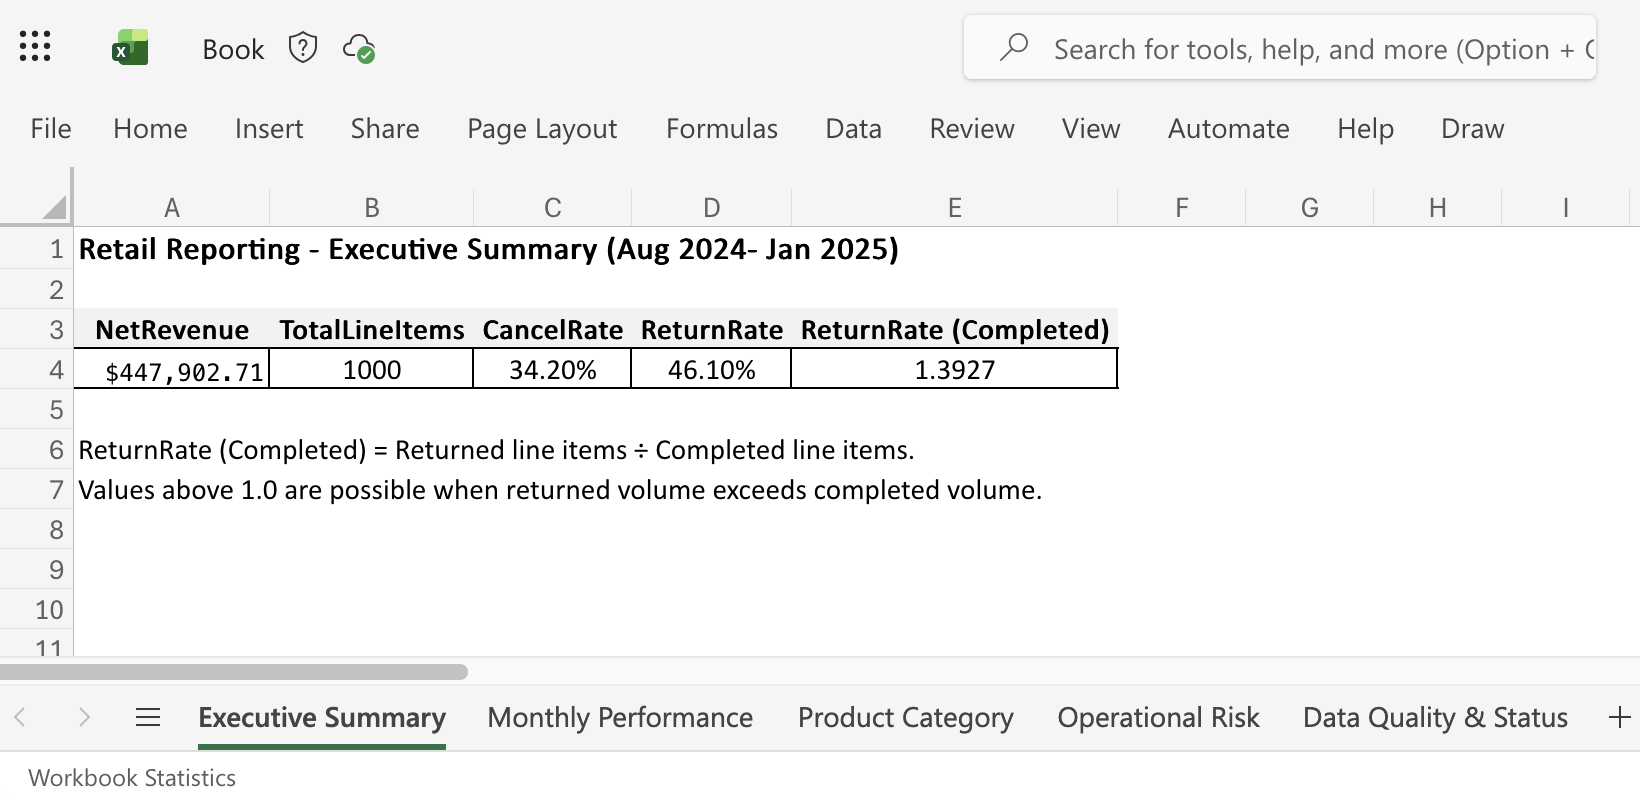
Executive Summary
- NetRevenue (completed-line only)
- TotalLineItems
- CancelRate
- ReturnRate
- ReturnRate (Completed Basis)
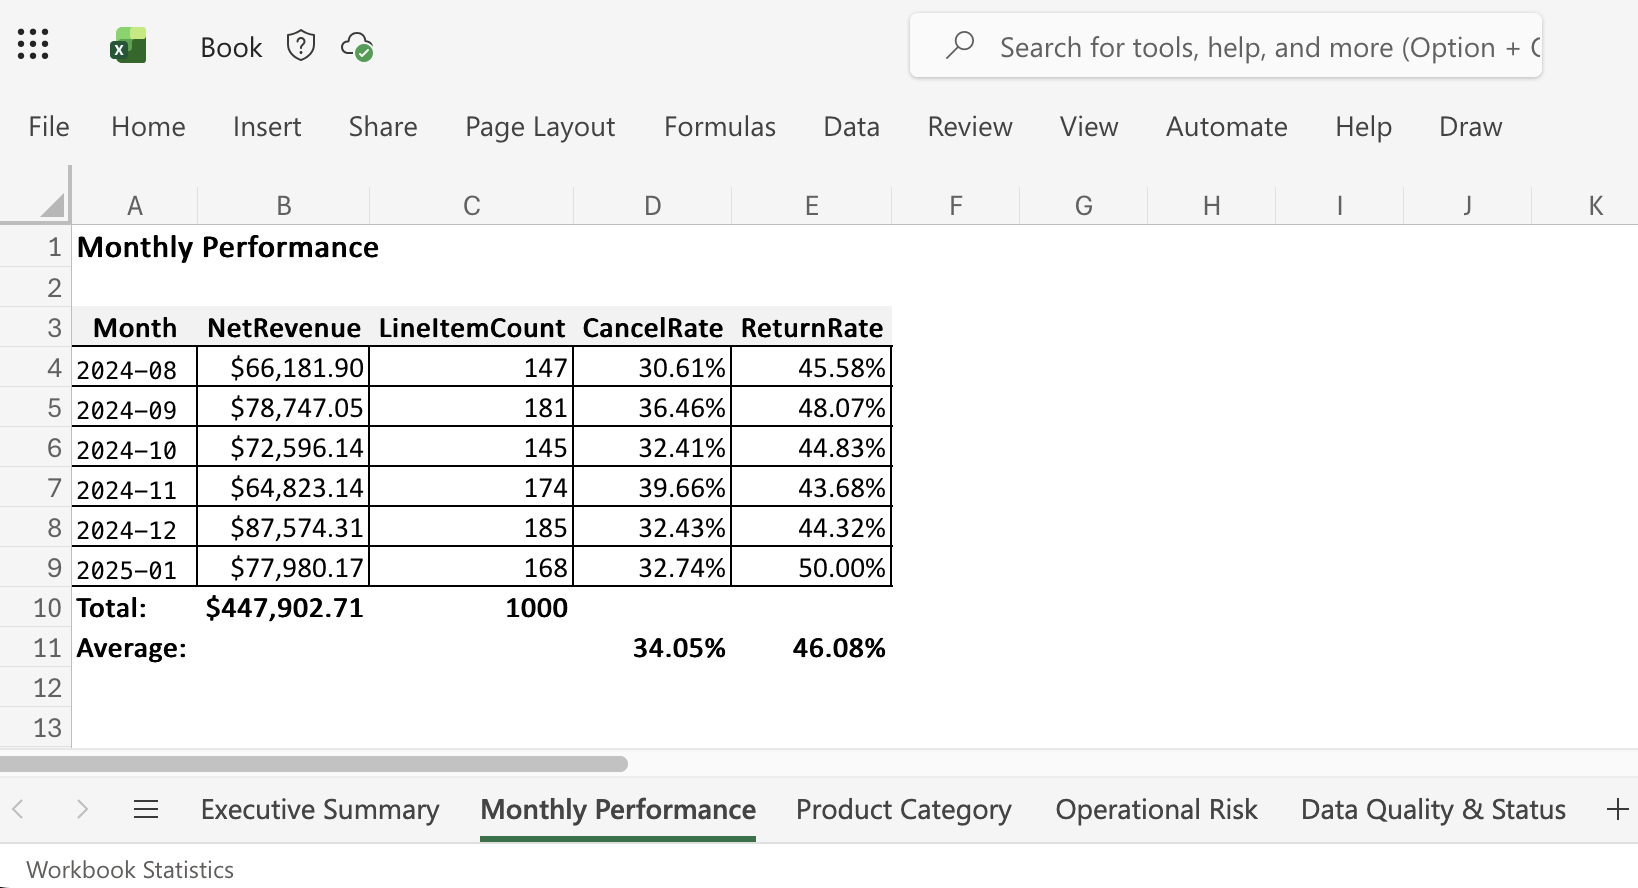
Monthly Performance
- Revenue and volume by month
- CompletionRate
- CancelRate
- ReturnRate
Revenue Mix
- ProductCategory distribution
- SalesChannel distribution
- Regional composition
- Revenue concentration metrics
Operational Monitoring
- Channel-level CancelRate
- Channel-level ReturnRate
- CompletionRate by channel
Data Quality & Status
- Status distribution
- Revenue by status (gross)
- Clear distinction between gross revenue and completed-line revenue
All presentation tabs are fully pivot-driven.
No hardcoded metrics remain.
Key Operational Insights
Fulfillment Friction:
67% of line items are classified as Canceled or Returned, indicating substantial leakage across the transaction lifecycle.
Revenue Concentration:
Approximately 51% of gross revenue is concentrated in two product categories, increasing dependency on those segments.
Status Signal Independence:
TransactionStatus and ReturnFlag operate as independent signals, reinforcing the importance of explicit driver definitions.
Values reflect recorded source data without modification.
Reporting Controls
- Source data preserved in Data_Raw
- KPI definitions fixed prior to aggregation
- All summary views reconcile to transaction-level calculations
- No manual overrides in presentation tabs
The workbook is designed to stand independently as an Excel-based operational reporting workflow, from transaction intake through reconciled executive summary.