- Problem
- SQL skills are difficult to demonstrate through screenshots of queries alone. I wanted an accessible way for someone to inspect a dataset, run SQL, and see the results directly in a browser.
- Solution
I built a SQLite database from the retail dataset and configured a Datasette Lite website to explore it. The implementation includes a data preparation script, working tables, four KPI views, metadata configuration, and GitHub Pages hosting.
Datasette Lite supplies the browser interface and SQL execution environment; my work focuses on the data model, configuration, queries, and surrounding demonstration.
- Result
- A working, read-only SQL demonstration where visitors can run queries, inspect results, and compare selected measures with the companion Excel reporting project.
- Evidence
- The live demo, the KPI views, and the worked example below, which was run against the demo database.
What it is
A browser-based SQL demonstration built around a retail transactions dataset. I used SQLite and Datasette Lite to make the data explorable through a web interface, with working tables, reusable KPI views, and executable SQL examples.
The project demonstrates SQL querying and the configuration of a lightweight exploration website. It also serves as a companion to my Excel reporting project, using the same dataset to examine selected measures from another angle.
Datasette Lite provides the browser-based SQLite/WASM execution environment and interface. I built the data preparation script that produces the SQLite database, the working layer, four KPI views, metadata configuration, SQL examples, and GitHub Pages hosting.
- Raw table:
transactions - Working layer:
working_transactions, which mirrors the Excel driver columns - KPI views:
kpi_checks_summary,kpi_monthly,kpi_channel,kpi_status_distribution
The KPI logic is defined once in working_transactions and rolled up into the views, so the SQL views stay internally consistent and traceable to the same definitions used in the Excel workflow. The two have been reconciled against each other; no automated mechanism keeps them in step across the two repositories.
Business question to interpretation
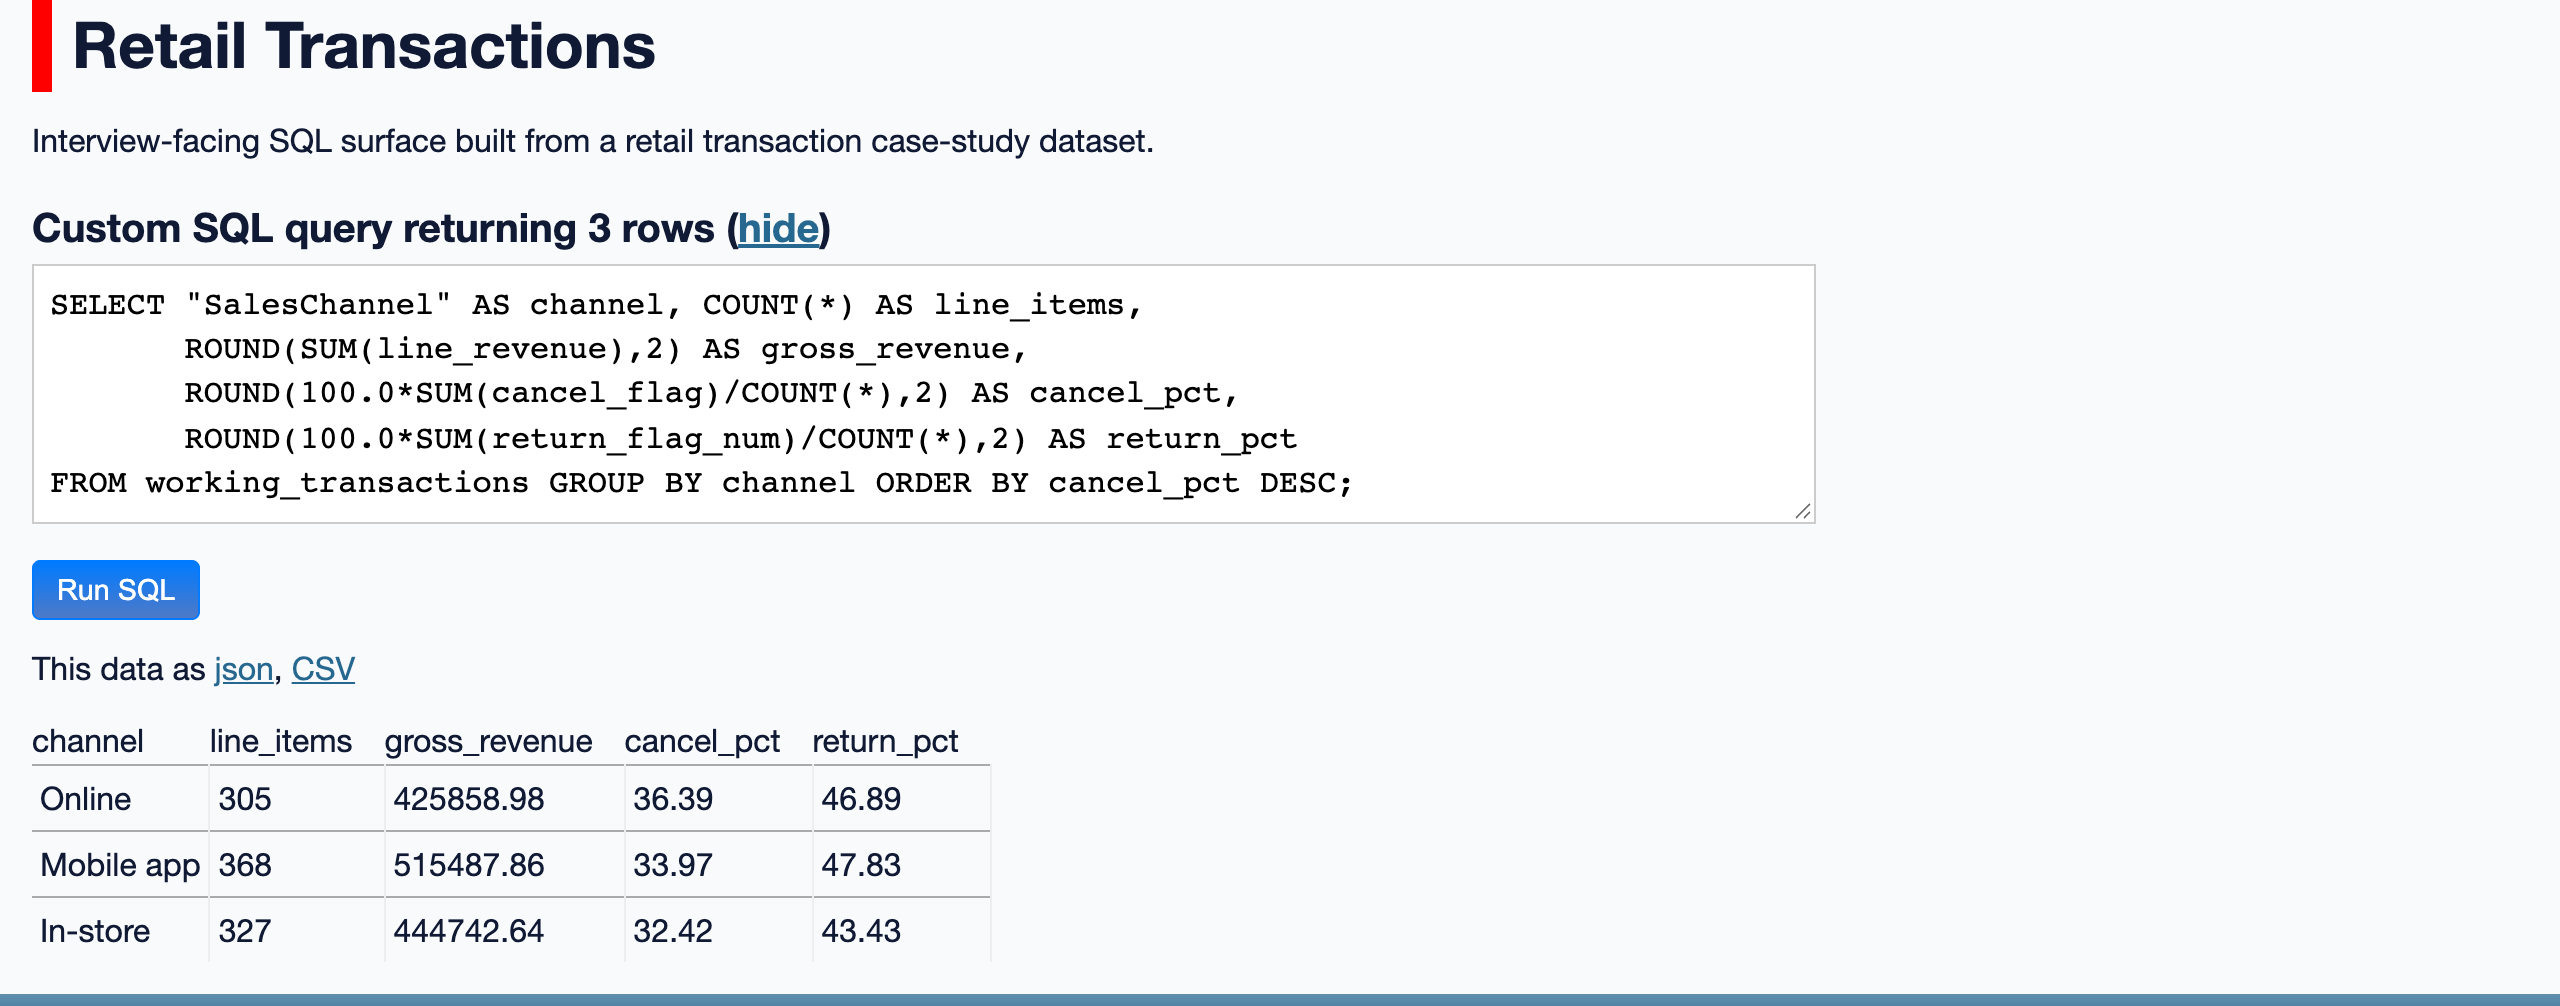
The point of the project is the workflow: business question to SQL query to result to interpretation. One worked example follows.
Question: Which sales channel has the highest cancellation rate?
SELECT sales_channel, line_items, cancel_pct, return_pct, completion_pct
FROM kpi_channel
ORDER BY cancel_pct DESC;
Result:
| sales_channel | line_items | cancel_pct | return_pct | completion_pct |
|---|---|---|---|---|
| Online | 305 | 36.39 | 46.89 | 28.20 |
| Mobile app | 368 | 33.97 | 47.83 | 34.78 |
| In-store | 327 | 32.42 | 43.43 | 35.78 |
Interpretation: Online has the highest cancellation rate at 36.39%, and In-store the lowest at 32.42%. The gap is small, so channel alone does not explain the cancellations. Online also has the lowest completion rate at 28.20%, which is worth a closer look. These figures describe the simulated dataset, not a real retailer.
A second question
Question: How does completed-line net revenue move by month?
SELECT month, net_revenue, line_items, completion_pct,
       ROUND(net_revenue / line_items, 2) AS revenue_per_line
FROM kpi_monthly
ORDER BY month;
Result:
| month | net_revenue | line_items | completion_pct | revenue_per_line |
|---|---|---|---|---|
| 2024-08 | 66,181.90 | 147 | 31.29 | 450.22 |
| 2024-09 | 78,747.05 | 181 | 34.25 | 435.07 |
| 2024-10 | 72,596.14 | 145 | 35.17 | 500.66 |
| 2024-11 | 64,823.14 | 174 | 31.03 | 372.55 |
| 2024-12 | 87,574.31 | 185 | 33.51 | 473.37 |
| 2025-01 | 77,980.17 | 168 | 33.33 | 464.17 |
Interpretation: December has the highest completed-line net revenue. Completion rates stay close to one third each month. November has more line items than October but the lowest revenue per line, so volume alone does not explain the monthly movement.
Reconciliation
The kpi_checks_summary view records the same totals the Excel Checks layer uses, so the two projects can be compared. It reports 1,000 line items, gross line revenue of 1,386,089.47, completed-line net revenue of 447,902.72, 331 completed lines and 342 canceled lines.
AI use, oversight and validation
No AI runs in this product. The published queries and views are deterministic SQL, and the results above were produced by executing that SQL. Anyone can reproduce them against the live demo. Human review covers the view definitions and the checks.
Project evolution
This project originally demonstrated SQL with WGU Reddit data and transitioned to the retail dataset in March 2026. The Datasette Lite architecture remained unchanged across that transition.
Limitations
- The dataset is simulated. It does not represent a real retailer.
- The explorer is read-only by design. It demonstrates querying and inspection, not a production database.
- Channel differences are small and are not evidence of a cause.
Status and links
The read-only SQL demo and its repository remain the practical inspection surfaces.
Roadmap
- Add more worked queries that make the SQL-to-business-question path easier to inspect.
- Document the manual Excel-to-SQL reconciliation boundary and checks.
- Improve dataset and view documentation without changing the read-only SQLite and Datasette Lite identity.
Changelog
- 2026-03: Transitioned the Datasette Lite demonstration from WGU Reddit material to the retail dataset while retaining its browser-based architecture.
- Undated release milestone: Published the SQLite database, four KPI views and executable SQL examples.
North Star
A compact, transparent SQL learning and review surface where a reader can inspect the data model, execute the query and understand its reporting implication in one place.