- Problem
- When reporting is built directly on raw transaction data, every summary can use a slightly different definition of revenue, status or returns. Totals drift apart and the numbers stop being trusted.
- Solution
- An executive reporting package that presents monthly performance, revenue mix, operational monitoring, and data-quality views from a simulated retail dataset.
- Result
- An executive summary, monthly, mix and operational views that reconcile back to transaction-level calculations on a simulated dataset of 1,000 line items.
- Evidence
- The downloadable workbook and the reporting figures below.
What it is
This is an Excel reporting system built on a simulated retail transaction dataset. It is not real company or ERP data. The dataset is a public Kaggle retail sales file, used here because it has realistic transaction structure and grain.
- Period covered: 2024-08-03 to 2025-01-30
- Volume: 1,000 transaction line items
- Structure: 32 fields
- Grain: one row is a single product-level transaction line item
Source dataset: Retail Sales Dataset (Kaggle).
The Retail SQL Explorer is a companion demonstration that uses the same dataset in a browser-based SQL interface.
How it works
The download contains five presentation sheets: Executive Summary, Monthly Performance, Product Category, Operational Risk, and Data Quality & Status. It is an executive reporting package, not a downloadable source-to-pivot workbook. The project Notes describe the reporting logic and reconciliation approach; they do not claim hidden tabs that are absent from the downloadable file.
Reconciliation and data quality
Cross-field checks found 399 line items (39.9%) where transaction status, payment status and shipping status do not align. Those records were disclosed and carried forward unchanged rather than silently corrected.
The reporting views make the dataset’s reconciliation limits visible rather than presenting its results as clean operational fact.
Reporting views
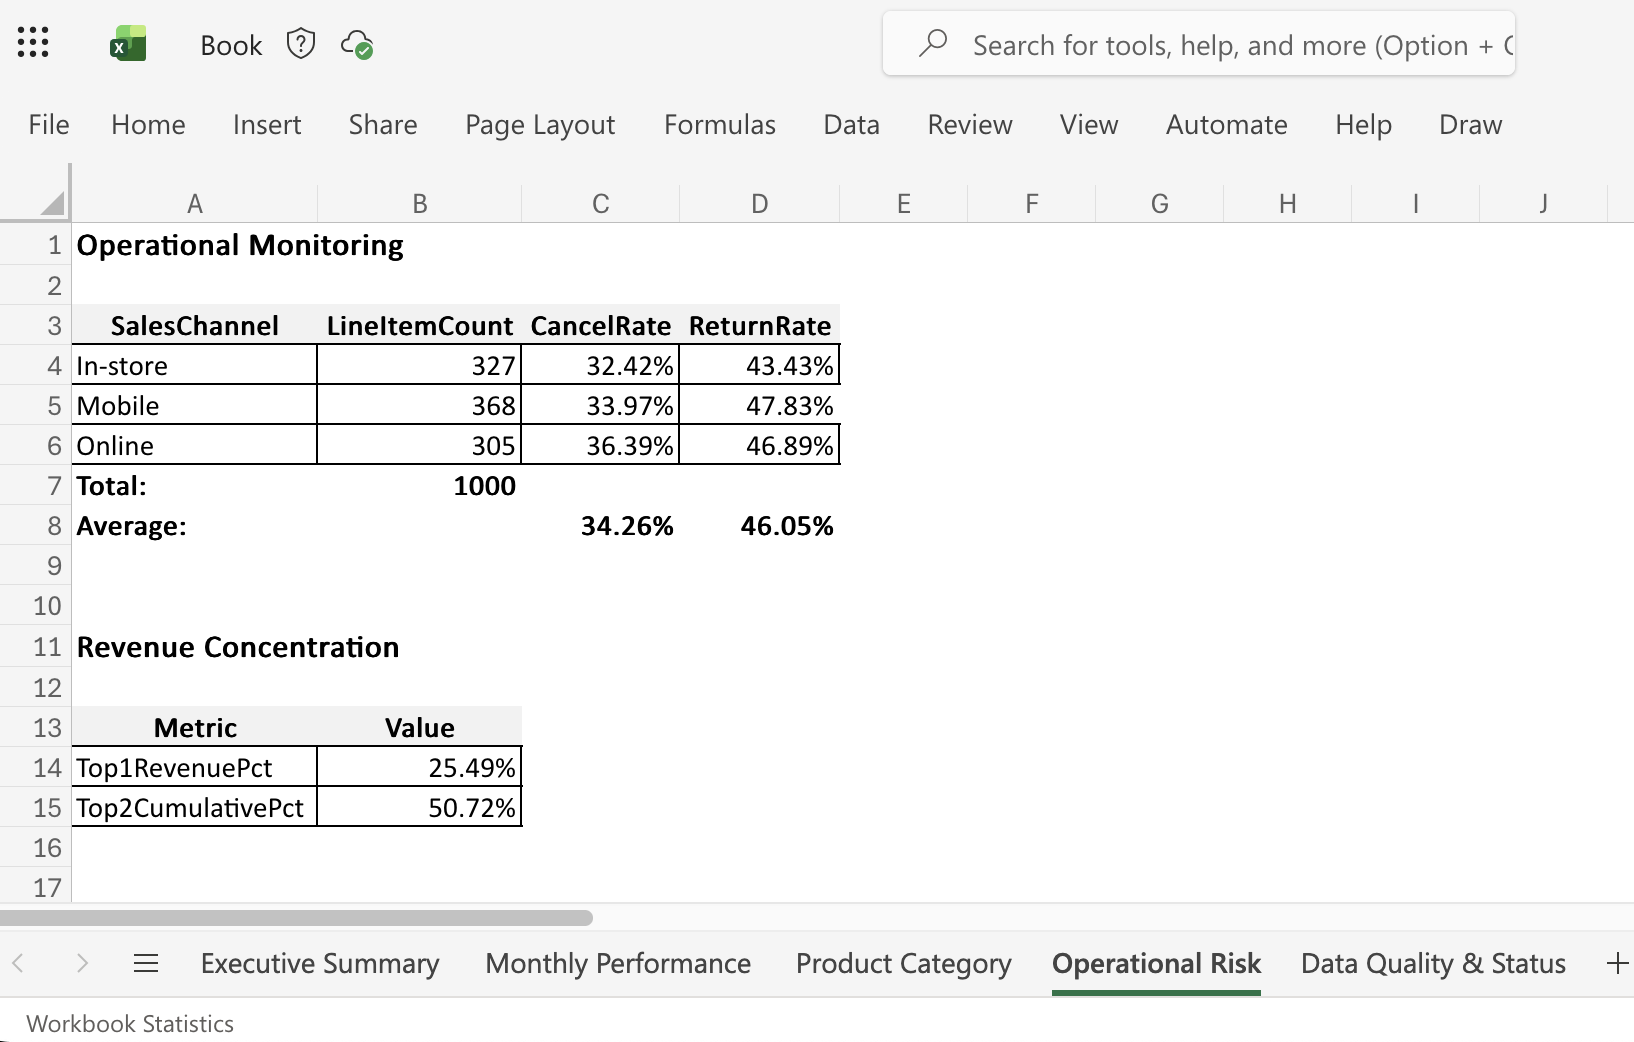
The presentation tabs include an Executive Summary, Monthly Performance, Revenue Mix, Operational Monitoring, and a Data Quality and Status view. Every presentation tab is pivot-driven, with no hardcoded metrics.
Key observations from the simulated data:
- About 67% of line items are canceled or returned, which points to friction across the transaction lifecycle.
- About 51% of gross revenue sits in two product categories, which concentrates the result in a small part of the catalog.
- Transaction status and the return flag behave as independent signals, which is why explicit driver definitions matter.
These values describe the simulated dataset only.
AI use, oversight and validation
No AI runs in this workbook. The logic uses Excel formulas and pivot tables, with human review of field definitions and reconciliation checks.
Limitations
- The dataset is simulated. It does not represent real ERP or company performance.
- The status inconsistencies are disclosed but not resolved. A real reporting process would need a defined correction rule.
- No mortgage, trading or financial-services experience is claimed. This is retail-style operational reporting.
Status and links
Completed. The workbook is available as a download below. It has no hosted application.
Roadmap
- Add a documented refresh checklist and input-validation examples for the simulated-data workflow.
- Make reconciliation exceptions easier to trace from summary view back to source rows.
- Preserve the workbook as a reproducible demonstration, not a claim about employer operations.
Changelog
- 2026-10-14: Added to the seven-project V1 portfolio as a supporting reporting case study.
- Undated workbook milestone: Completed the executive reporting package.
North Star
A reusable reporting pattern in which definitions, validation and decision-ready views stay connected from source rows through the final report.